NATURAL CAPITAL

SEEDING SUSTAINABILITY
FOR A BETTER TOMORROW

SDGs IMPACTED

At Nuvoco, we are dedicated to maintaining socially responsible and environmentally sustainable operations. Sustainability is at the core of our growth strategy, prompting us to minimise the environmental impact and ensure our operations adhere to sustainable practices.

Our ‘Protect Our Planet’ agenda is well crafted, incorporating the growing focus towards ESG and gaining momentum with each passing day. Sustainability has become a non-negotiable imperative for all our stakeholders including customers, employees, partners, investors, regulators, and the communities wherein we operate.

KEY HIGHLIGHTS

457 KG CO2

One of the LOWEST CARBON EMISSIONS achieved in the industry

13%

Utilisation of AFR in our processes

1.8x

Water positivity achieved

~1.1

Million metric tons carbon sink created

CAPITAL TRADE-OFFS

NATURAL CAPITAL

CAPITALS IMPACTED
  • Financial

  • Manufactured

  • Intellectual

  • Social and Relationship

STAKEHOLDERS IMPACTED
  • Communities

  • Regulatory
    Authority
    and Industry
    Associations

  • Customers

MATERIAL ISSUES ADDRESSED
  • Decarbonisation and Climate Change

  • Water & Waste Management

  • Biodiversity

  • Circular Economy

KEY FOCUS AREAS IMPACTED
  • Fuel Mix Optimisation

  • Cost Efficiency

Our approach prioritises minimising and mitigating adverse effects on the environment and society, ensuring that every aspect of our operations reflects our commitment to sustainability. Through our initiatives and sustainable products, we actively contribute to the well-being of the planet while enhancing our operational efficiency. By embracing this ethos, we not only navigate the high-growth phase responsibly but also strive to positively impact the world around us.

PROTECT OUR PLANET AGENDA

The Protect Our Planet (POP) agenda, initiated in FY 2022-23 as an accelerator program, has successfully progressed to the next phase, representing a major step forward in our sustainability efforts. By incorporating sustainability into all operations and utilising a governance system with monthly performance tracking, we have focused on key areas identified in materiality assessments.

POP aligns our initiatives with key environmental topics. This strategic approach has led to the creation of sustainability roadmaps aimed at decarbonisation, water management, Circular economy, Biodiversity, and Waste reduction, and enhancing the sustainability and efficiency of our operations. Through continuous evaluation and improvement of our efforts, we are committed to cultivating a culture of sustainability and safeguarding our planet for future generations.

CLIMATE ACTION - MANAGING ENERGY CONSUMPTION AND EMISSIONS

As a cement manufacturing Company, managing energy consumption and emissions is crucial to achieving sustainable operations. At Nuvoco, we have taken significant measures to address this material issue and use it as a competitive advantage for the Company. We are consistently enhancing the integration of green power and alternative fuels within our operations. This ongoing commitment is pivotal to our strategy for reducing Greenhouse Gas (GHG) emissions, highlighting our dedication to sustainable practices.

We have one of the lowest carbon footprints in the industry, with carbon emission at 457 Kg CO2 per tonne of cementitious materials.
Parameter Performance during
FY 2023-24
Performance during
FY 2022-23
Cement: Scope 1 CO2 Emissions
457 Kg/tonne of cementitious materials 462 Kg/tonne of cementitious materials
RMX: Scope 1 + Scope 2 CO2 Emissions
2.64 KgCO2/m3 concrete produced 2.89 KgCO2/m3 concrete produced
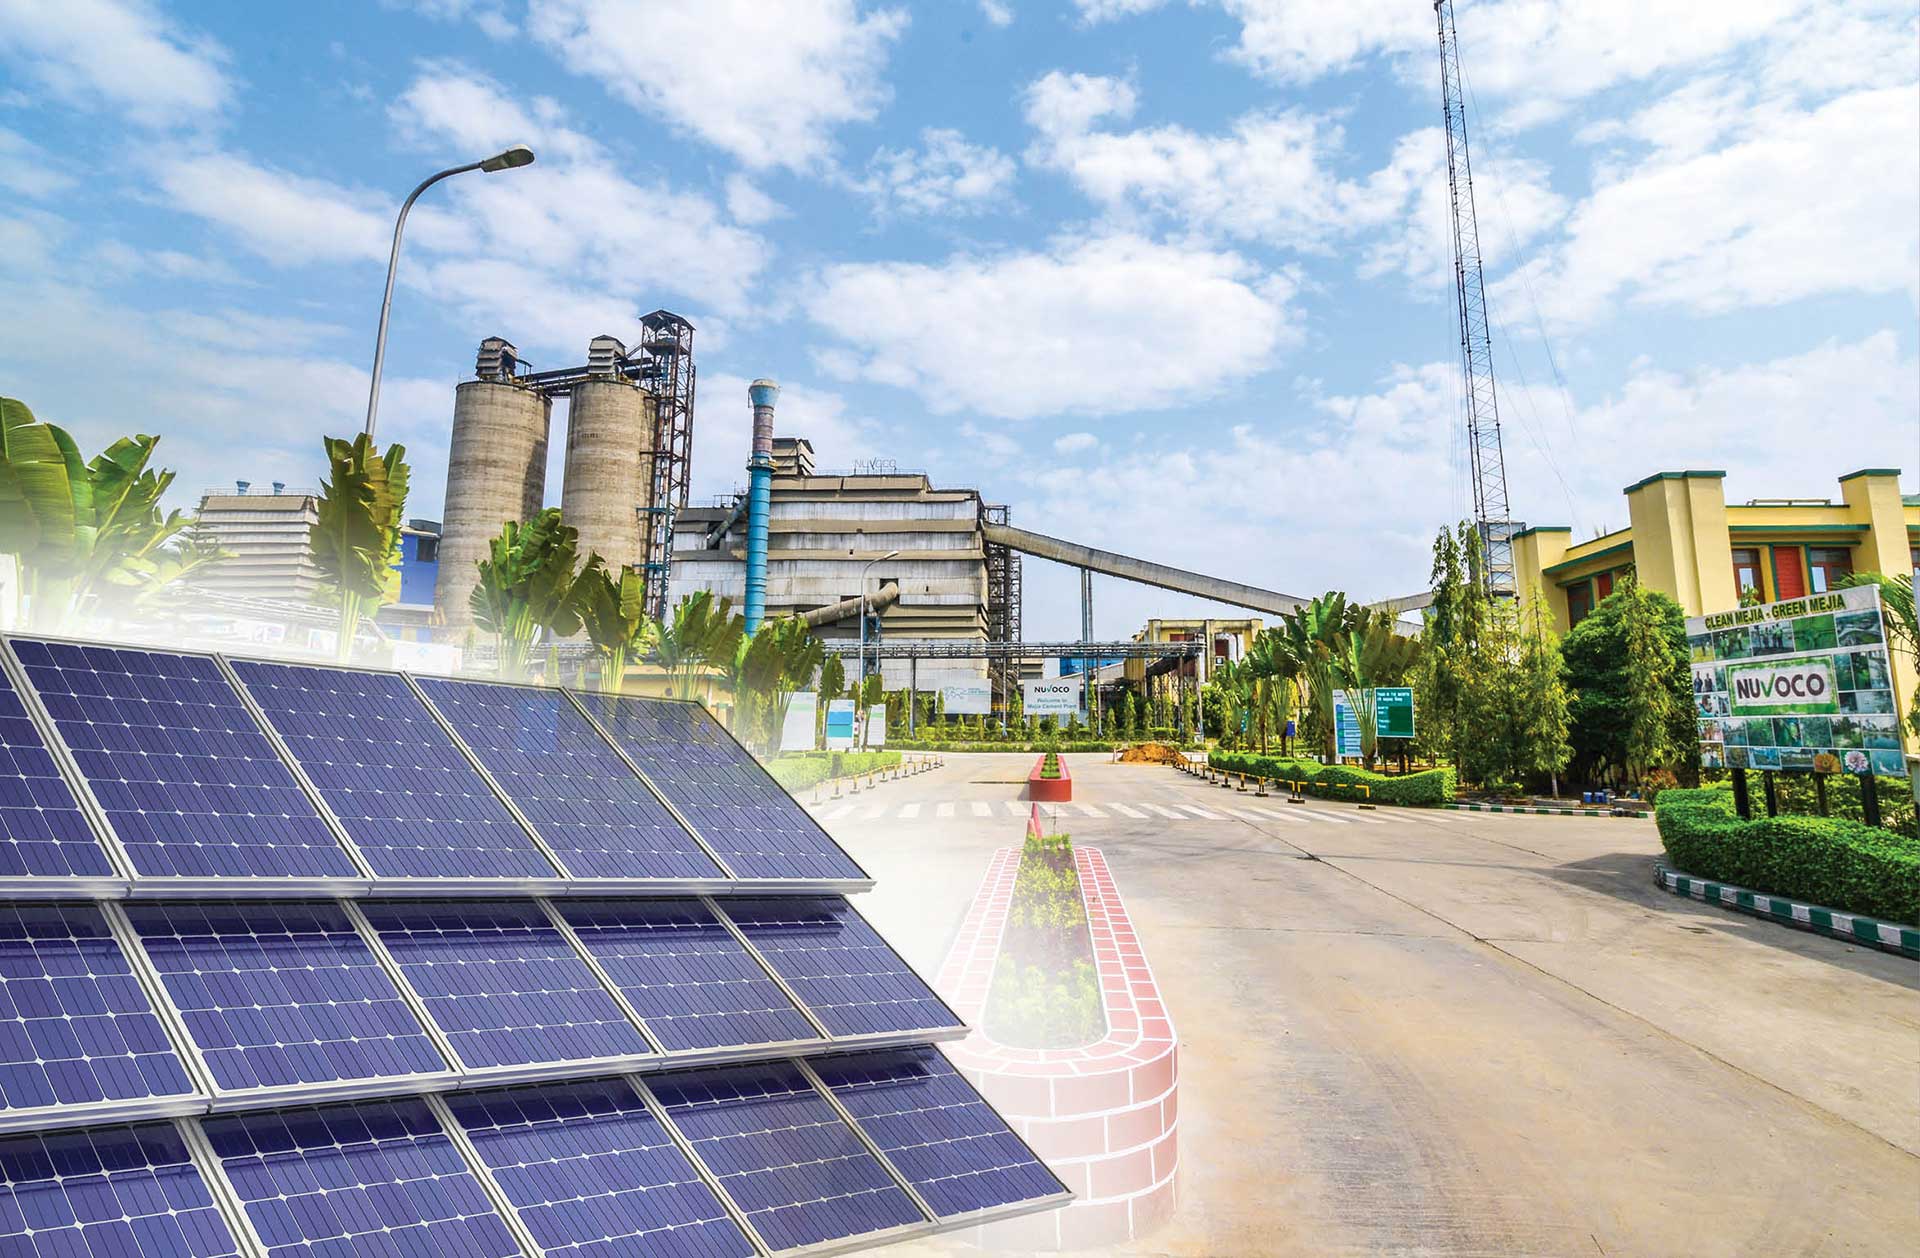
Solar Power Capacity
5.3 MWp of Solar Power Capacity installed 1.5 MWp of Solar Power Capacity installed
AFR
13% AFR achieved 9% AFR achieved

ENSURING ENERGY EFFICIENCY

Our commitment to green energy and energy efficiency remains strong. To enhance our energy efficiency, we are actively engaged in the following initiatives:

  • Waste Heat Recovery System (WHRS) installations

    We harness waste heat generated from manufacturing processes as a clean energy source for operations, reducing reliance on the grid. Our current installations have a capacity of 44.7 MW combined, with plans for further optimisation to increase power generation.

  • Solar Energy Generation

    Our solar energy capacity surged to 5.3 MW this year from the previous 1.5 MW, and we are aiming to expand this further in the coming years.

  • Fleet Expansion

    Our Compressed Natural Gas (CNG) truck fleet has grown significantly to 175 in FY 2023-24 from 80 in FY 2022-23, enhancing efficiency and reducing emissions in transportation operations.

Alternative Fuel & Raw Material (AFR)

As part of our sustainability initiatives, we have been efficiently managing our power & fuel mix by replacing fossil fuels with alternative fuels in our operations. Our manufacturing processes enable the use of waste materials from industries like steel and thermal power generation as alternative fuels. Our mix of alternative fuels includes solid waste, liquid solvent, biomass, refuse-derived fuels (RDF) from municipal solid waste, and other substances, with a focus on biomass. However, in line with our sustainability objectives, we plan to considerably expand our use of alternative fuels in the coming years.

ADOPTING CIRCULARITY

At Nuvoco, our commitment to advancing the principles of the circular economy is deeply ingrained in our sustainability programme. We actively engage in various initiatives to reduce waste, promote resource efficiency, and minimise our environmental footprint.

  • Utilisation of Industrial Waste

    We collaborate with other industries to incorporate their waste into our operations, effectively reducing waste generation and enhancing resource efficiency. By utilising waste and substitute materials in our product mixes, such as blended cement with reduced clinker content, we minimise waste disposal and significantly reduce carbon emissions.

  • Recycling in Concrete Manufacturing

    In our Ready-Mix Concrete (“RMX”) plants, we integrate recycled aggregates sourced from Construction and Demolition (C&D) waste into the manufacturing process. This practice not only enhances the sustainability of our concrete products but also promotes resource efficiency by repurposing materials that would otherwise end up in landfills.

  • Harnessing Heat from waste and Promoting Recycling

    We maximise our operational efficiency by recovering energy at our facilities as an alternative fuel, reintegrating this energy into our processes. Additionally, we promote the use of recycled plastic packaging, exemplified by the utilisation of 79.4 lakhs bags made from recycled polypropylene in the current year

  • Installation of Aqua Zero Debris Recycler

    Solid concrete waste and slurry disposal pose significant challenges for RMX plants. We developed the “Nu Aqua Zero Debris Recycler System” to tackle this issue by minimizing debris generation and recycling wastewater for reuse. This environmentally friendly method reduces freshwater consumption and solid waste, promoting sustainability and a circular economy in the concrete industry. Our aim is to implement 15 new systems by FY 2024-25

  • Advancements in Utilisation of Alternative Raw Materials (ARM)

    During the year, the utilisation of Alternative Raw Materials (ARM) in our processes increased to 33.9% in cement production, up from 27.7% in the previous year. Incorporating materials such as chemical gypsum, fly Ash, and slag into our cement formulations significantly reduced our reliance on virgin raw materials and further promoted circularity in our operations.

  • Reducing paper

    Prioritising environmental responsibility, Nuvoco has taken significant steps to reduce paper usage within the organisation by adopting digitalisation. This included facilitation of faster and easier transactions during online employee travel and expense management. Through this initiative, paper usage worth approximately ₹60 lakhs was avoided.

PROTECTING BIODIVERSITY

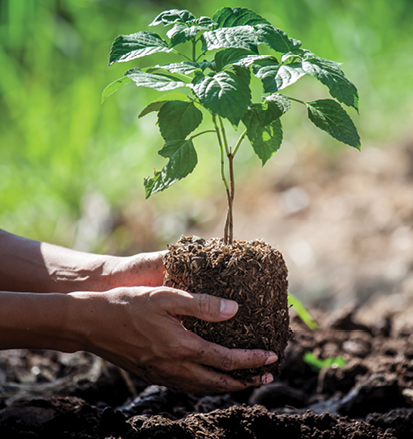
Our Standard Operating Procedures prioritise planting native species to achieve ecosystem balance. We meticulously select and prepare sites, tailoring them to local geography and climate for optimal survival. Timely planting and consistent care, including watering and pest control, promote healthy tree development and foster biodiversity. These efforts have yielded the planting of 1,15,782 saplings, creating a significant carbon sink of roughly 1.1 million metric tons. Additionally, our Sonadih Cement Plant has been awarded with the ‘5-star rating’ for our sustainable mining operations, recognising our commitment to environmental responsibility for the third time by the Indian Bureau of Mines. Chittor plant triumphed at the QCFl National Sustainability Awards, clinching the title of ‘Excellent Unit’ in three distinct categories: Energy, AFR, and Water.

~1,19,000

Saplings of native species

85%

Survival rate 9 months after plantation

~1.1

Million metric tons carbon sink

WATER RESOURCE MANAGEMENT

Water is an essential resource for our operations, and a number of measures have been taken to conserve and effectively utilise this precious resource. In our water management strategy, we embrace the principles of the ‘5R’ approach of Reduce, Reuse, Recycle, Recharge, and Respect for water.

Throughout the year, our focus on water management has yielded tangible results. The utilisation of recycled and reused water increased to 10% of our total freshwater consumption, and we also augmented our rainwater harvesting capabilities. Completion of watershed delineation at all sites, aided by satellite imagery, further enhanced our understanding of surface runoff potential, guiding targeted conservation efforts. We also conducted thorough internal audits during the year to optimise the usage.

~11%

Reduction in fresh water use intensity (litre per tonne of cementitious materials)

1.8X

Water Positive Index

9%

Reuse of treated wastewater into sprinkling, gardening and other processes

4%

Reduction in Specific Freshwater Consumption (KL/m3 of Concrete) in FY 2023-24

PRODUCT RESPONSIBILITY

Our product development strategy is rooted in a sense of responsibility, ensuring that our products are safe and environmentally conscious. The widespread adoption of such products contributes positively to green initiatives. Additionally, we focus on eco-friendly transportation and delivery methods to minimise environmental impact while ensuring accessibility to our products.

We have introduced environmentally friendly products like Concreto, Duraguard, and ECODURE concrete, some of which have received GreenPro Certification from the Indian Green Building Council (IGBC) for their sustainability. Our product portfolio offers blended cements such as Portland Composite Cement (PCC) and Portland Slag Cement (PSC), with efforts underway to increase their market share. Despite market dynamics favouring Ordinary Portland Cement (OPC) and resulting in a slight decline in our cement-to-clinker ratio, we remain committed to sustainable practices and are adapting strategies accordingly. This year, an additional 11 Ready-Mix Concrete (“RMX”) plants were accredited with Green Pro certification, marking progress in our sustainability efforts.

AIR EMISSIONS

We consistently track air emissions from fuel combustion in our cement manufacturing and power generation operations. The burning of fossil fuels releases pollutants such as Oxides of Sulphur (SOx), Oxides of Nitrogen (NOx), and Particulate Matter (PM), which require stringent monitoring. We ensure compliance with regulatory standards by using the Continuous Emission Monitoring System (CEMS) to monitor these emissions.

Throughout the year, both our stack and fugitive emissions have stayed within the permissible limits set by Pollution Control Boards. Moreover, our ongoing monitoring of fugitive emissions ensures that we meet pre-requisite air quality standards.

ENVIRONMENTAL PERFORMANCE INDICATORS AS PER GLOBAL REPORTING INITIATIVE STANDARDS ARE SUBJECT TO EXTERNAL ASSURANCE

GRI Indicators FY 2023-24 FY 2022-23
301-1 - Materials used by weight or volume i. Non-renewable materials used (Natural Materials - Raw meal including limestone, sand & aggregates) - tonnes 1,53,28,704 2,39,39,237
ii. Reused materials (Flyash, Slag & Chemical Gypsum) - tonnes 78,72,062 79,70,393
301-2 - Recycled input materials used Percentage of Recycled/reused input materials used to manufacture the organisation's primary products and services 34.00% 24.98%
302-1: Energy consumption within the organisation Total fuel consumption within the organisation from non-renewable sources (GJ) - Includes alternate fuels other than biomass 4,15,04,205 3,68,87,685
Total fuel consumption within the organisation from renewable sources (GJ) Nil Nil
Electricity consumption (GJ) - Grid 9,69,046 25,66,731
Electricity consumption (GJ) - (WHRS & Solar) 9,29,504 9,16,531
Total energy consumption (GJ) 4,24,33,708 4,03,81,098
302-3: Energy intensity Energy intensity ratio for the organisation (GJ/tonne of Cementitious materials) 2.28 2.11
*Specific Heat Consumption (Kcal/Kg Clinker) 711.2 712
303-3: Water withdrawal Total water withdrawal from all areas (Kilo Litres) 29,22,372 29,79,395.00
Total process + domestic withdrawal (Kilo Litres) 22,43,124
Total water discharge to all areas in megalitres, and a breakdown of this total by destination Implements ZLD at all sites
303-5: Water consumption Total water consumption from all areas (Kilo Liters) 29,22,372 29,79,395
Total process + domestic consumption (Kilo Liters) 22,43,124 -
305-1: Direct (Scope 1) emissions Direct (Scope 1) GHG emissions in metric tons of CO2 85,01,933 61,47,691
305-2: Indirect (Scope 2) emissions Indirect (Scope 2) GHG emissions in metric tons of CO2 1,69,250 3,85,866
305-4: GHG emissions intensity GHG emissions intensity ratio for the organisation (in KgCO2/TCM) 457 462
305-7: NOx, SOx, and other significant air emissions SOx - tonnes 1,084 871
NOx - tonnes 7,990 12,175
PM - tonnes 835 1,024
306-2 - Management of significant waste-related impacts Actions, including circularity measures, taken to prevent waste generation in the organisation’s own activities and upstream and downstream in its value chain, and to manage significant impacts from waste generated. Please refer page 64
If the waste generated by the organisation in its own activities is managed by a third party, a description of the processes used to determine whether the third party manages the waste in line with contractual or legislative obligations. The processes used to collect and monitor waste-related data
306-3: Waste generated Total waste generated (tonnes) - (Plastic, E-Waste, Biomedical, Batteries, Hazardous and Flyash) 2,44,102.78 4,21,127
306-4: Waste diverted from disposal Waste recycled and reused (tonnes) 2,43,663.52 4,20,871
306-5: Waste directed to disposal Waste disposed (tonnes) 4,949.5 1,020
*Note: Not a GRI disclosure. #As per the Central Ground Water Authority (CGWA) list of notified area.